Imagine navigating a vast ocean without a compass or map. That's what trading in the stock market can feel like without the right investment tools. Stock market indicators are like your navigational aids, helping you make sense of the tumultuous waves of market trends. But do these indicators really work? Let's dive in and explore the world of stock market analysis and technical indicators to find out.
The Role of Stock Market Indicators
Stock market indicators are essential trading signals that help investors and traders understand market behavior. They are like the weather forecasts for the financial world, providing insights into potential market movements. But do these indicators always point us in the right direction?
Understanding Technical Indicators
Technical indicators are mathematical calculations based on historical price, volume, or open interest information. They help traders identify patterns and trends in the market. Think of them as your financial GPS, guiding you through the complexities of stock market analysis. Some popular technical indicators include moving averages, Relative Strength Index (RSI), and Bollinger Bands.
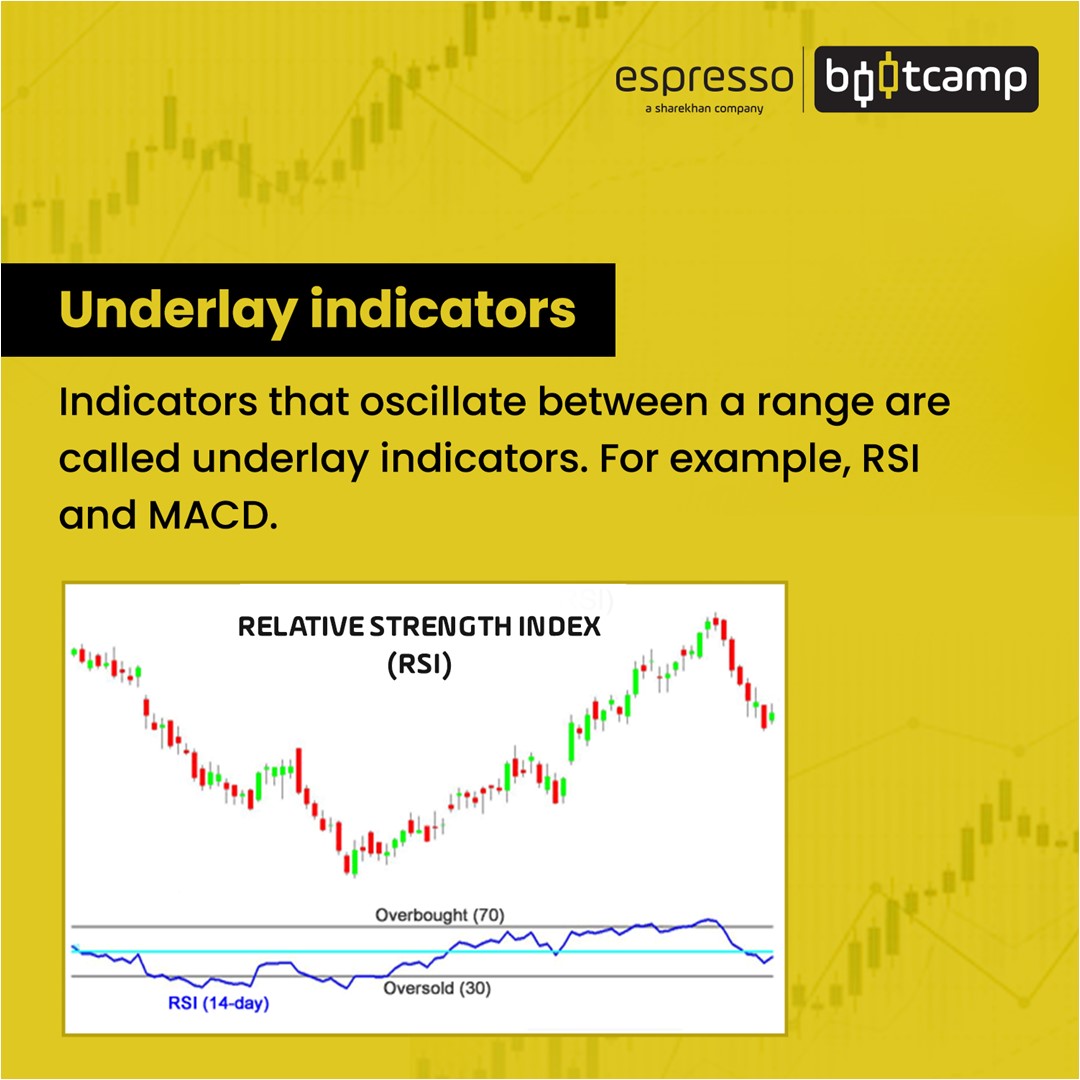
For instance, moving averages smooth out price data to form a trend-following indicator. They help you see the overall direction of the market, much like how a compass points north. The RSI, on the other hand, measures the speed and change of price movements, helping you identify overbought or oversold conditions. It's like a speedometer that tells you when to slow down or speed up.
The Science Behind Market Trends
Market trends are the backbone of stock market analysis. They represent the general direction in which a market is moving. Identifying these trends can be the difference between a profitable trade and a costly mistake. Technical indicators play a crucial role in spotting these trends. For example, a rising moving average might indicate a bullish trend, while a falling one might signal a bearish trend.
But here's the catch: market trends can be fickle. They can change direction suddenly, leaving even the most seasoned traders scratching their heads. This is where the reliability of indicators comes into question. Do they always give accurate trading signals? The answer is not straightforward.
The Reliability of Stock Market Indicators
So, do stock market indicators really work? The short answer is yes, but with a caveat. Indicators are powerful tools, but they are not infallible. They work best when used in conjunction with other forms of analysis and a solid understanding of market dynamics.
The Limitations of Indicators
Indicators are based on historical data, which means they can sometimes lag behind current market conditions. This lag can lead to false signals, causing traders to make incorrect decisions. For example, a moving average might continue to point upwards even after the market has started to decline. This is known as a lagging indicator.
Moreover, indicators can be subjective. Different traders might interpret the same data differently, leading to varied conclusions. This subjectivity can make it challenging to rely solely on indicators for trading decisions.
Combining Indicators for Better Accuracy
To mitigate these limitations, many traders use a combination of indicators. This approach, known as confirmation, helps increase the reliability of trading signals. For instance, you might use a moving average to identify the overall trend and the RSI to confirm overbought or oversold conditions. This dual approach can provide a more comprehensive view of the market.
Additionally, combining technical indicators with fundamental analysis can further enhance accuracy. Fundamental analysis involves evaluating a company's financial health and market position. By integrating both types of analysis, you can make more informed trading decisions.
Real-World Examples
Let's look at a real-world example to illustrate the effectiveness of stock market indicators. Consider the case of Apple Inc. (AAPL). In 2020, the stock experienced a significant rally, driven by strong earnings and innovative product releases. Technical indicators like the moving average and RSI would have provided valuable insights into this trend. A rising moving average would have indicated a bullish trend, while the RSI would have helped identify potential buying opportunities.
However, the COVID-19 pandemic also caused significant volatility in the market. During this period, indicators might have provided mixed signals, making it challenging to predict market movements. This highlights the importance of using indicators in conjunction with other forms of analysis and staying informed about external factors affecting the market.
Conclusion
So, do stock market indicators really work? The answer is a resounding yes, but with a few caveats. Indicators are powerful tools for stock market analysis, providing valuable insights into market trends and trading signals. However, they are not foolproof and should be used in conjunction with other forms of analysis. By understanding their limitations and combining them with fundamental analysis, you can make more informed trading decisions.
Remember, the stock market is a complex and ever-changing landscape. Indicators are your compass and map, but they are not the destination. Use them wisely, stay informed, and always be prepared to adapt. Happy trading!
Frequently Asked Questions
1. What are the most reliable stock market indicators?
There is no one-size-fits-all answer to this question. The reliability of stock market indicators can vary depending on the market conditions and the specific asset being analyzed. However, some of the most commonly used and reliable indicators include moving averages, Relative Strength Index (RSI), and Bollinger Bands.
2. Can stock market indicators predict future market movements?
Stock market indicators are based on historical data and can provide insights into potential future movements. However, they are not crystal balls and cannot predict the future with absolute certainty. They should be used as part of a broader analysis strategy.
3. How do I choose the right indicators for my trading strategy?
Choosing the right indicators depends on your trading style and goals. For example, if you are a trend follower, moving averages might be more suitable. If you are a momentum trader, indicators like RSI or MACD might be more appropriate. Experiment with different indicators and see which ones work best for your strategy.
4. What are the limitations of using technical indicators?
The main limitations of technical indicators include lag, subjectivity, and the potential for false signals. Indicators are based on historical data, which means they can sometimes lag behind current market conditions. Additionally, different traders might interpret the same data differently, leading to varied conclusions.
5. How can I improve the accuracy of my trading signals?
To improve the accuracy of your trading signals, consider using a combination of indicators and integrating technical analysis with fundamental analysis. This dual approach can provide a more comprehensive view of the market and help you make more informed trading decisions.
```
Posting Komentar