Imagine navigating a bustling city without a map or GPS. You'd likely get lost, miss important landmarks, and struggle to find your way. The same goes for the stock market. Without understanding how to read stock market indicators, you're essentially wandering blindly through a financial jungle. But fear not! This guide will equip you with the tools you need to decipher market trends, make informed investment strategies, and become a savvy financial trader.
Understanding the Basics of Stock Market Analysis
Before diving into the specifics of technical indicators, let's lay the groundwork. Stock market analysis is the process of evaluating the performance and potential of stocks. It involves examining historical data, market trends, and various financial metrics to predict future movements. Think of it as learning the language of the market. Once you grasp the basics, you'll be better equipped to read the signals and make informed decisions.
Why Learn How to Read Stock Market Indicators?
In the world of financial trading, knowledge is power. Understanding how to read stock market indicators gives you a competitive edge. It helps you identify opportunities, manage risks, and optimize your investment strategies. Whether you're a seasoned investor or just starting out, mastering these skills is crucial for long-term success.
Key Technical Indicators to Watch
Technical indicators are tools used to analyze market trends and make predictions. They are based on historical price and volume data, providing insights into the market's behavior. Here are some of the most commonly used technical indicators:
Moving Averages
Moving averages smooth out price data to form a trend-following indicator. They help identify the direction of the trend and potential support or resistance levels. There are different types of moving averages, such as simple moving averages (SMA) and exponential moving averages (EMA). Which one you choose depends on your trading style and preferences.
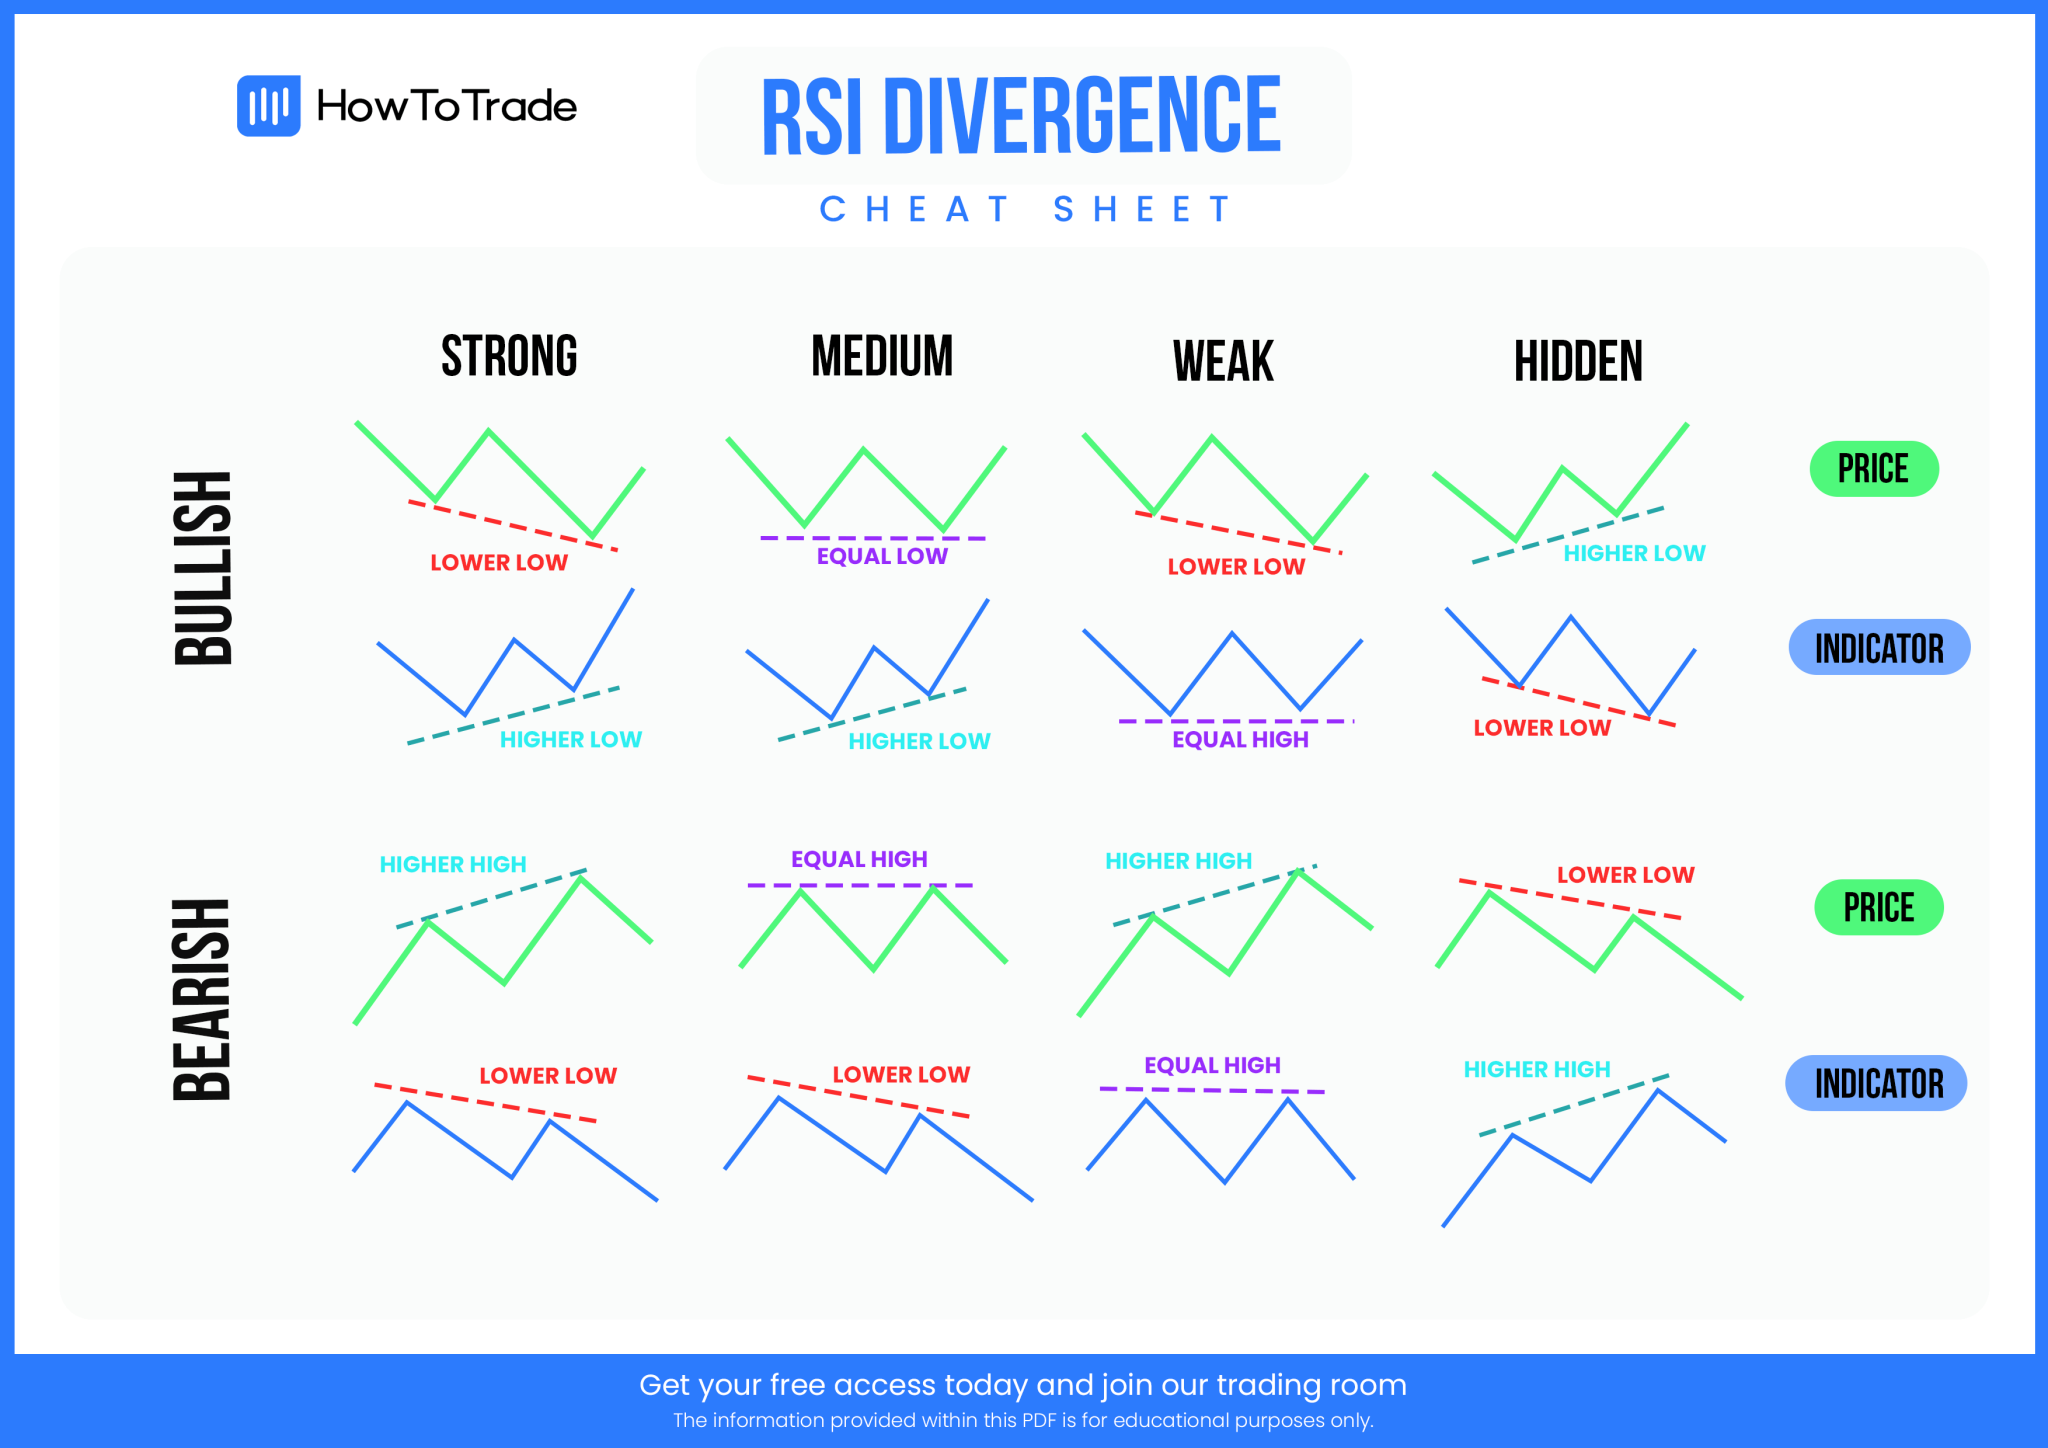
Relative Strength Index (RSI)
The Relative Strength Index (RSI) is a momentum oscillator that measures the speed and change of price movements. It ranges from 0 to 100, with values above 70 indicating overbought conditions and values below 30 indicating oversold conditions. RSI is a valuable tool for identifying potential reversals in market trends.
Bollinger Bands
Bollinger Bands consist of a simple moving average and two standard deviations above and below it. They provide a visual representation of volatility and potential support or resistance levels. When the bands widen, it indicates increased volatility, and when they narrow, it suggests decreased volatility. This indicator is particularly useful for traders who focus on volatility and price swings.
Interpreting Market Trends
Market trends are the general direction in which the market is moving. They can be upward (bullish), downward (bearish), or sideways (ranging). Understanding how to interpret these trends is essential for successful financial trading. Here are some tips to help you read the market trends accurately:
Identifying Bullish Trends
A bullish trend is characterized by a series of higher highs and higher lows. This indicates that the market is in an uptrend, and prices are generally increasing. To identify a bullish trend, look for consistent upward movements in price and volume. This is often accompanied by positive news and economic indicators.
Recognizing Bearish Trends
A bearish trend, on the other hand, is marked by a series of lower highs and lower lows. This suggests that the market is in a downtrend, and prices are generally decreasing. To spot a bearish trend, watch for consistent downward movements in price and volume. Negative news and economic indicators often accompany this trend.
Navigating Sideways Trends
Sideways trends, or ranging markets, occur when the price moves within a narrow range without a clear upward or downward direction. These trends can be challenging to navigate, but they present opportunities for range-bound trading strategies. Look for support and resistance levels to identify potential entry and exit points.
Developing Effective Investment Strategies
Now that you understand how to read stock market indicators and interpret market trends, it's time to develop your investment strategies. Here are some tips to help you create a robust and effective plan:
Diversification: The Key to Risk Management
Diversification is the practice of spreading your investments across different asset classes, sectors, and geographies. This strategy helps mitigate risks by ensuring that your portfolio is not overly exposed to any single market or sector. Think of it as not putting all your eggs in one basket. Diversification can help protect your investments from significant losses and enhance your overall returns.
Setting Clear Goals and Objectives
Before making any investment decisions, it's crucial to set clear goals and objectives. Ask yourself: What are your financial goals? What is your risk tolerance? How long is your investment horizon? Answering these questions will help you tailor your investment strategies to your unique needs and preferences. Remember, a well-defined plan is the foundation of successful financial trading.
Staying Informed and Adaptable
The stock market is dynamic and ever-changing. To stay ahead of the game, you need to stay informed and adaptable. Regularly monitor market trends, economic indicators, and news events that could impact your investments. Be prepared to adjust your strategies as needed to capitalize on new opportunities and manage risks effectively.
Conclusion
Learning how to read stock market indicators is a crucial skill for any investor. By understanding technical indicators, interpreting market trends, and developing effective investment strategies, you can navigate the financial jungle with confidence. Remember, knowledge is power, and the more you know, the better equipped you'll be to make informed decisions and achieve your financial goals.
So, are you ready to take the first step towards becoming a savvy financial trader? Start by familiarizing yourself with the key technical indicators, stay informed about market trends, and develop a robust investment strategy. The world of financial trading awaits, and with the right tools and knowledge, you can conquer it.
FAQs
What are the most important technical indicators for beginners?
For beginners, it's essential to start with the basics. Moving averages, Relative Strength Index (RSI), and Bollinger Bands are some of the most important technical indicators to learn. These tools provide valuable insights into market trends and potential price movements, helping you make informed investment decisions.
How can I improve my stock market analysis skills?
Improving your stock market analysis skills requires practice and continuous learning. Start by studying historical data and market trends. Use technical indicators to analyze price movements and identify potential opportunities. Additionally, stay informed about economic indicators and news events that could impact the market. Regularly review and adjust your strategies based on new information and market conditions.
What is the best investment strategy for a beginner?
The best investment strategy for a beginner is one that focuses on diversification and risk management. Start by setting clear goals and objectives, and then spread your investments across different asset classes, sectors, and geographies. This approach helps mitigate risks and enhances your overall returns. Additionally, stay informed about market trends and be prepared to adjust your strategies as needed.
How do I stay informed about market trends?
Staying informed about market trends requires regular monitoring of financial news, economic indicators, and technical analysis. Follow reputable financial news sources, attend webinars and seminars, and use technical indicators to analyze price movements. Additionally, consider using financial trading platforms that provide real-time data and analysis tools. Staying informed will help you make better investment decisions and capitalize on new opportunities.
What are the common mistakes to avoid in financial trading?
Common mistakes in financial trading include not having a clear investment strategy, over-trading, and letting emotions dictate decisions. To avoid these pitfalls, start by setting clear goals and objectives. Develop a robust investment strategy that focuses on diversification and risk management. Avoid making impulsive decisions based on short-term market fluctuations, and always stay informed about market trends and economic indicators.
```
Posting Komentar