Imagine you're navigating a vast ocean, and your ship is your investment portfolio. The share market is your sea, full of opportunities and risks. Just as a seasoned captain relies on navigational tools to steer clear of storms and find safe harbors, investors use indicators in the share market to make informed decisions. But what exactly are these indicators, and how do they help us understand stock market trends? Let's dive in and explore.
Understanding Market Indicators
Market indicators are like the compass and sextant of the investing world. They provide crucial financial metrics and market signals that help investors gauge the health of the market and individual stocks. These indicators can be broadly categorized into two types: fundamental and technical.
Fundamental Indicators
Fundamental indicators focus on the intrinsic value of a company. Think of them as the ship's logbook, detailing the company's financial health, management quality, and market position. Key fundamental indicators include:
- Earnings per Share (EPS): This metric tells you how much profit a company makes for each outstanding share of its stock. A higher EPS generally indicates a more profitable company.
- Price-to-Earnings Ratio (P/E Ratio): This compares a company's stock price to its earnings per share. It helps you understand whether a stock is overvalued or undervalued.
- Debt-to-Equity Ratio (D/E Ratio): This measures a company's financial leverage. A lower D/E ratio suggests a more stable financial structure.
By analyzing these fundamental indicators, investors can make more informed decisions about which stocks to buy, hold, or sell. But what about the short-term movements? That's where technical indicators come into play.
Technical Indicators
Technical indicators are like the weather vane on your ship, helping you predict short-term market movements based on historical price and volume data. Technical analysis is the art of interpreting these indicators to identify stock market trends and potential trading opportunities.
Some of the most popular technical indicators include:
- Moving Averages: These smooth out price data to form a trend-following indicator. A simple moving average (SMA) is the average price over a specific period, while an exponential moving average (EMA) gives more weight to recent prices.
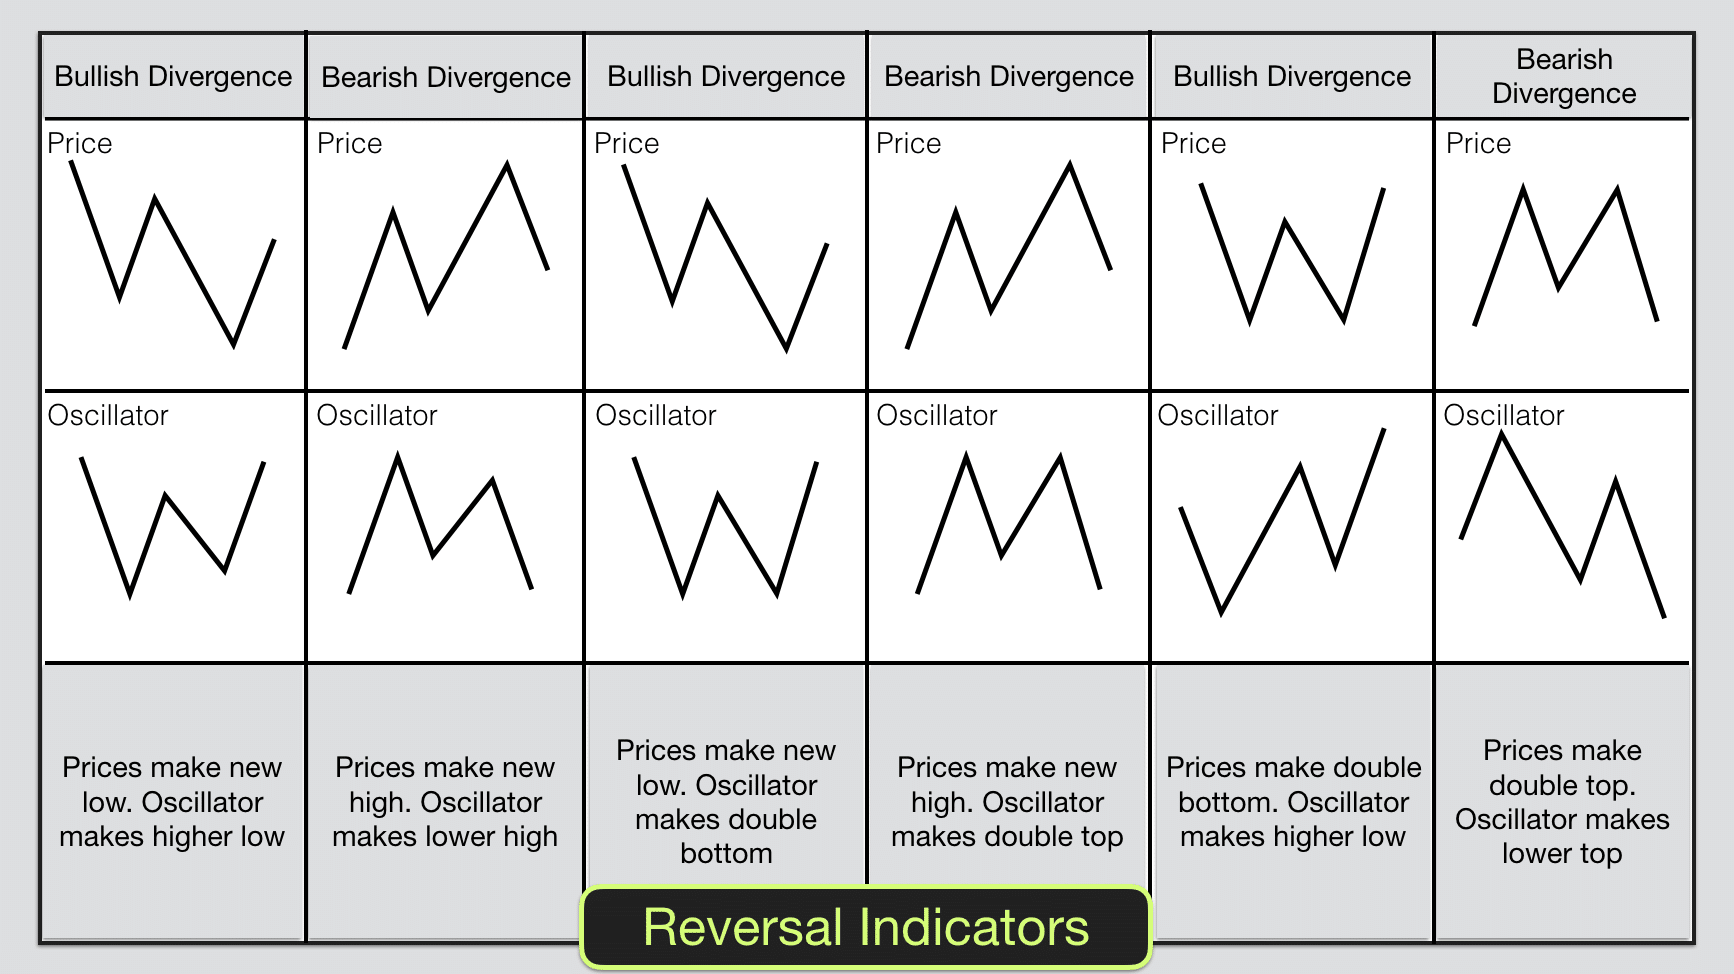
- Relative Strength Index (RSI): This measures the speed and change of price movements. An RSI above 70 typically indicates that a stock is overbought, while an RSI below 30 suggests it is oversold.
- Bollinger Bands: These consist of a simple moving average and two standard deviations above and below it. They help identify volatility and potential breakouts.
Technical indicators are invaluable investor tools for short-term traders and those looking to capitalize on market volatility. But how do you know which indicators to use?
Choosing the Right Indicators
The right indicators depend on your investment goals and time horizon. If you're a long-term investor, fundamental indicators will be your primary focus. If you're a day trader, technical indicators will be more relevant. But remember, no single indicator can provide a complete picture. It's essential to use a combination of indicators to confirm your analysis.
For example, you might use the P/E ratio to identify undervalued stocks and then use moving averages to time your entry and exit points. Or, you might use the RSI to identify overbought or oversold conditions and then use Bollinger Bands to confirm potential breakouts.
It's also crucial to stay updated with the latest market trends and adjust your indicators accordingly. The share market is dynamic, and what worked yesterday might not work today. So, always keep learning and adapting.
The Role of Indicators in Technical Analysis
Technical analysis is the study of past market data to predict future price movements. It's like reading the tea leaves of the market, looking for patterns and signals that can guide your trading decisions. Indicators play a central role in technical analysis, providing the data and insights needed to make informed trades.
For instance, you might use a combination of moving averages and RSI to identify a potential trend reversal. If the price crosses above a key moving average and the RSI is below 30, it could signal a buying opportunity. Conversely, if the price crosses below a moving average and the RSI is above 70, it might indicate a selling opportunity.
But remember, technical analysis is not foolproof. It's just one tool in your investing toolkit. Always combine it with fundamental analysis and other forms of research to make well-rounded investment decisions.
Conclusion
In the vast and often turbulent sea of the share market, indicators are your navigational tools. They provide the financial metrics and market signals you need to make informed investment decisions. Whether you're a long-term investor focusing on fundamental indicators or a short-term trader relying on technical analysis, understanding and using the right indicators can significantly improve your chances of success.
So, are you ready to set sail and navigate the share market with confidence? Start by familiarizing yourself with the key indicators and how to use them. And remember, the market is always changing, so keep learning and adapting. Your future self will thank you.
FAQs
What are the most important indicators in the share market?
The most important indicators depend on your investment goals and time horizon. For long-term investors, fundamental indicators like EPS, P/E ratio, and D/E ratio are crucial. For short-term traders, technical indicators like moving averages, RSI, and Bollinger Bands are more relevant.
How do I use indicators in technical analysis?
In technical analysis, indicators are used to identify trends, potential reversals, and trading opportunities. For example, you might use moving averages to identify a trend and RSI to confirm overbought or oversold conditions. Always combine technical analysis with fundamental analysis for better results.
Can indicators predict market movements?
Indicators can provide valuable insights into potential market movements, but they are not foolproof. They are just one tool in your investing toolkit. Always combine them with other forms of research and analysis to make well-rounded investment decisions.
What is the difference between fundamental and technical indicators?
Fundamental indicators focus on the intrinsic value of a company, providing insights into its financial health and market position. Technical indicators, on the other hand, focus on historical price and volume data to predict short-term market movements.
How do I choose the right indicators for my investment strategy?
The right indicators depend on your investment goals and time horizon. Long-term investors should focus on fundamental indicators, while short-term traders should rely on technical indicators. Always use a combination of indicators to confirm your analysis and stay updated with the latest market trends.
```
Posting Komentar