Imagine you're driving a car. You have your eyes on the road ahead, but you also keep an eye on your speedometer and fuel gauge. The road ahead represents the future market trends, while the speedometer and fuel gauge are like your leading and lagging indicators. Understanding what are leading and lagging indicators in stock market is crucial for any investor looking to navigate the complex world of stock market analysis and financial forecasting. So, let's dive in and explore these essential investment metrics.
Understanding Leading Indicators
Leading indicators are like the weather forecast for the stock market. They provide insights into what might happen in the future. These indicators often precede changes in the market trends, giving investors a heads-up on potential shifts. Think of them as the early birds that signal the arrival of spring. They help you anticipate changes before they occur, allowing you to make informed decisions.
Common Leading Indicators
Several economic indicators fall under the category of leading indicators. Some of the most popular ones include:
- Consumer Confidence Index (CCI): This index measures how optimistic or pessimistic consumers are about the economy. A high CCI often indicates that consumers are likely to spend more, which can boost economic growth.
- Purchasing Managers' Index (PMI): This index surveys purchasing managers in various industries to gauge their outlook on business conditions. A rising PMI suggests that manufacturing activity is increasing, which can be a positive sign for the economy.
- Stock Market Indices: Indices like the S&P 500 or the Dow Jones Industrial Average (DJIA) can also act as leading indicators. Changes in these indices often precede broader economic trends.
For a deeper dive into leading indicators, you can explore resources like the Investopedia guide on leading indicators.
The Role of Lagging Indicators
Lagging indicators, on the other hand, are like the rearview mirror in your car. They show you what has already happened in the market. These indicators confirm trends that have already occurred, providing a clear picture of past performance. While they don't predict the future, they are invaluable for understanding the current state of the market and validating your investment strategies.
Common Lagging Indicators
Some of the most widely used lagging indicators include:
- Gross Domestic Product (GDP): GDP measures the total value of goods and services produced in an economy. It provides a comprehensive view of economic health but is released quarterly, making it a lagging indicator.
- Unemployment Rate: This metric shows the percentage of the labor force that is unemployed. A falling unemployment rate typically indicates a healthy economy, but it reflects past trends.
- Inflation Rate: Inflation measures the rate at which the general level of prices for goods and services is rising. It is a crucial indicator of economic health but lags behind current market conditions.
To learn more about lagging indicators, check out the Investopedia explanation on lagging indicators.
Combining Leading and Lagging Indicators
So, how do you use leading and lagging indicators together? Think of it as a balancing act. Leading indicators give you a glimpse into the future, allowing you to make proactive decisions. Lagging indicators, meanwhile, provide a reality check, helping you validate your strategies based on past performance. By combining both, you can create a well-rounded approach to stock market analysis and financial forecasting.
For example, if the Consumer Confidence Index (a leading indicator) is rising, you might anticipate increased consumer spending. However, you would also look at the unemployment rate (a lagging indicator) to ensure that the job market is stable. This dual approach helps you make more informed and balanced investment decisions.
Practical Applications
Let's consider a practical scenario. Imagine you're an investor looking at the tech sector. You notice that the PMI for the tech industry is rising (a leading indicator), suggesting increased manufacturing activity. At the same time, you see that the unemployment rate in the tech sector is falling (a lagging indicator), confirming that the industry is healthy. This combination of indicators might prompt you to invest more in tech stocks.
On the other hand, if the PMI is falling and the unemployment rate is rising, you might decide to reduce your exposure to the tech sector. This is where the power of combining leading and lagging indicators comes into play.
Conclusion
Understanding what are leading and lagging indicators in stock market is essential for any investor looking to navigate the complexities of stock market analysis and financial forecasting. Leading indicators give you a glimpse into the future, while lagging indicators provide a reality check based on past performance. By using both types of indicators, you can make more informed and balanced investment decisions.
So, the next time you're analyzing market trends, remember to look both ahead and behind. Just like driving a car, it's all about balance and awareness. Happy investing!
FAQs
1. What are the primary differences between leading and lagging indicators?
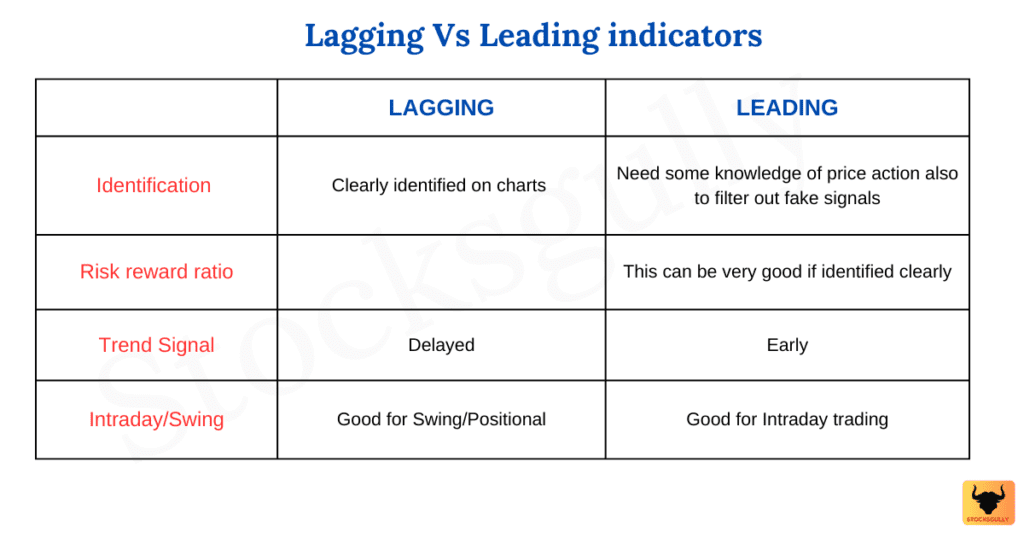
Leading indicators predict future market trends, while lagging indicators confirm past trends. Leading indicators help you anticipate changes, whereas lagging indicators provide a reality check based on historical data.
2. Can I rely solely on leading indicators for investment decisions?
While leading indicators are valuable for predicting future trends, relying solely on them can be risky. It's essential to combine them with lagging indicators to get a comprehensive view of the market.
3. How often should I review leading and lagging indicators?
The frequency of review depends on your investment strategy. For short-term traders, daily or weekly reviews might be necessary. For long-term investors, monthly or quarterly reviews could be sufficient.
4. Are there any tools or platforms that provide leading and lagging indicators?
Yes, many financial platforms and tools offer leading and lagging indicators. Examples include Bloomberg, Yahoo Finance, and various stock market analysis software.
5. Can leading and lagging indicators be used in other areas besides the stock market?
Absolutely. Leading and lagging indicators are used in various fields, including economics, business management, and even personal finance. They help in forecasting trends and validating strategies across different domains.
```
Posting Komentar