Imagine you're navigating a vast ocean. You need a compass, a map, and perhaps a weather forecast to guide you safely to your destination. In the world of investing, market indicators serve as your navigational tools, helping you make informed decisions amidst the turbulent waters of the financial markets. But what do you mean by market indicators? Let's dive in and explore these crucial investing terms that can steer you towards financial success.
What Do You Mean by Market Indicators?
Market indicators are statistical measures that provide insights into the current and future state of financial markets. They help investors, analysts, and economists gauge the overall health and direction of the economy. Think of them as the vital signs of the financial world, offering a snapshot of what's happening and what might happen next.
Types of Market Indicators
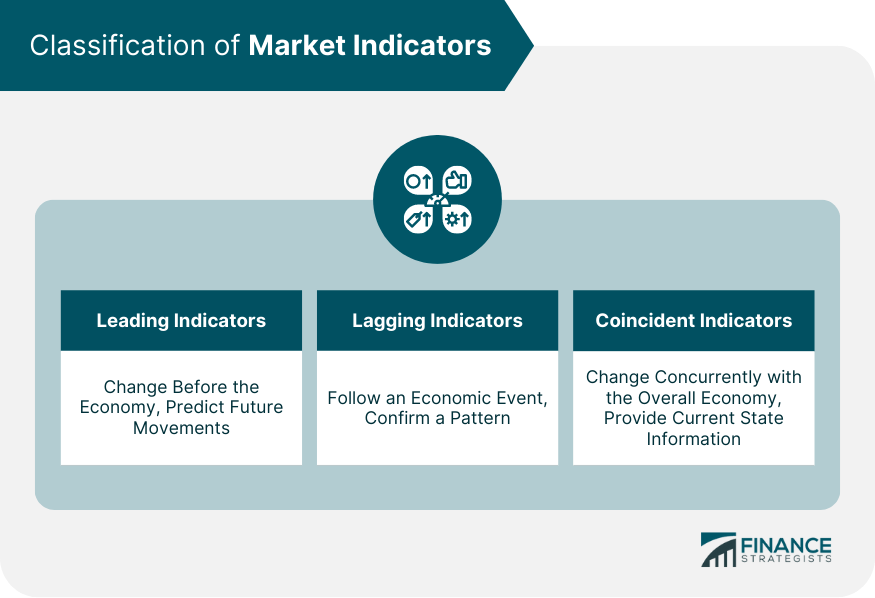
Market indicators can be broadly categorized into two main types: leading indicators and lagging indicators. Leading indicators are like the canaries in the coal mine, signaling potential changes before they occur. Lagging indicators, on the other hand, confirm trends that have already happened. Both are essential for comprehensive stock market analysis.
Leading Indicators
Leading indicators are forward-looking and can help you anticipate market movements. Some of the most commonly used leading indicators include:
- Consumer Confidence Index (CCI): Measures how optimistic or pessimistic consumers are about the economy. High confidence often translates to increased spending and economic growth.
- Purchasing Managers' Index (PMI): Reflects the health of the manufacturing sector. A PMI above 50 indicates expansion, while below 50 suggests contraction.
- Yield Curve: The difference between long-term and short-term interest rates. An inverted yield curve, where long-term rates are lower than short-term rates, often signals a recession.
Lagging Indicators
Lagging indicators confirm trends that have already occurred and are useful for validating your investment strategies. Key lagging indicators include:
- Gross Domestic Product (GDP): The total value of all goods and services produced in a country. It's a broad measure of economic health.
- Unemployment Rate: The percentage of the labor force that is unemployed. A low unemployment rate generally indicates a healthy economy.
- Consumer Price Index (CPI): Measures the average change over time in the prices paid by consumers for a basket of goods and services. It's a key indicator of inflation.
How to Use Market Indicators for Investing
Understanding what do you mean by market indicators is just the first step. The real magic happens when you learn how to use them effectively in your investing strategy. Here are some tips to get you started:
Diversify Your Indicators
Relying on a single indicator is like navigating with just a compass. You need a map and a weather forecast too. Diversify your indicators to get a more comprehensive view of the market. For example, combine leading indicators like the PMI with lagging indicators like GDP for a balanced perspective.
Stay Updated with Financial Data
The financial markets are dynamic, and so is the financial data that drives them. Stay updated with the latest economic indicators and financial market indicators to make timely and informed decisions. Regularly check reliable sources for the most current data.
Context Matters
Market indicators don't exist in a vacuum. They need to be interpreted within the broader economic context. For instance, a high unemployment rate might not be as concerning if it's accompanied by a booming tech sector. Always consider the bigger picture when analyzing indicators.
Common Pitfalls to Avoid
While market indicators are powerful tools, they're not foolproof. Here are some common pitfalls to avoid:
Over-Reliance on a Single Indicator
As mentioned earlier, relying on a single indicator can be risky. Markets are complex, and no single measure can capture all the nuances. Use a combination of indicators to get a more accurate picture.
Ignoring Economic Context
Market indicators should be interpreted within the broader economic context. Ignoring this context can lead to misinterpretations and poor investment decisions. Always consider the bigger economic picture.
Failing to Stay Updated
The financial markets are dynamic, and so is the financial data that drives them. Failing to stay updated with the latest economic indicators can lead to outdated and ineffective investment strategies. Regularly check reliable sources for the most current data.
Conclusion
So, what do you mean by market indicators? They are your compass, map, and weather forecast in the vast ocean of investing. By understanding and effectively using these investing terms, you can navigate the financial markets with greater confidence and success. Remember to diversify your indicators, stay updated with the latest financial data, and always consider the broader economic context. With these tools in your arsenal, you'll be well-equipped to make informed and profitable investment decisions.
Now, it's your turn to dive in and explore the world of market indicators. Start by identifying the key indicators that matter most to your investment strategy and stay updated with the latest financial data. The more you understand and use these indicators, the better equipped you'll be to navigate the financial markets and achieve your investment goals.
FAQs
What are the most important market indicators for stock market analysis?
The most important market indicators for stock market analysis include the Consumer Confidence Index (CCI), Purchasing Managers' Index (PMI), Yield Curve, Gross Domestic Product (GDP), Unemployment Rate, and Consumer Price Index (CPI). These indicators provide a comprehensive view of the economic health and direction, helping investors make informed decisions.
How often should I check market indicators?
The frequency of checking market indicators depends on your investment strategy and goals. For short-term traders, daily or weekly checks might be necessary. For long-term investors, monthly or quarterly reviews could be sufficient. The key is to stay updated with the latest financial data without getting overwhelmed by short-term fluctuations.
Can market indicators predict market crashes?
Market indicators can provide signals that a market crash might be imminent, but they are not foolproof predictors. Leading indicators like the Yield Curve and PMI can signal potential downturns, but they should be used in conjunction with other indicators and economic context for a more accurate assessment.
What is the difference between leading and lagging indicators?
Leading indicators are forward-looking and signal potential changes before they occur. Examples include the Consumer Confidence Index (CCI) and Purchasing Managers' Index (PMI). Lagging indicators, on the other hand, confirm trends that have already happened. Examples include Gross Domestic Product (GDP) and the Unemployment Rate.
How can I use market indicators to improve my investment strategy?
To improve your investment strategy with market indicators, diversify your indicators to get a comprehensive view, stay updated with the latest financial data, and always consider the broader economic context. By using a combination of leading and lagging indicators, you can make more informed and timely investment decisions.
```
Posting Komentar