Imagine navigating a bustling city without a map or GPS. You'd likely get lost, right? The same principle applies to the stock market. Without the right tools, you're essentially wandering in the dark. This is where technical indicators come into play. They are your map, your compass, and your GPS all rolled into one, guiding you through the complex world of stock market analysis and helping you make informed decisions. So, how do you use these indicators effectively? Let's dive in.
Understanding Technical Indicators
Technical indicators are mathematical calculations based on historical price, volume, or open interest information. They help traders identify market trends and potential reversals. Think of them as your financial analysis toolkit. But how do you choose the right ones? And how do you use them to your advantage?
Types of Technical Indicators
There are three main types of technical indicators: trend indicators, momentum indicators, and volatility indicators. Each serves a unique purpose in your trading strategy.
- Trend Indicators: These help you identify the direction of the market. Think of them as your trend-spotting binoculars. Examples include Moving Averages and the Average Directional Index (ADX).
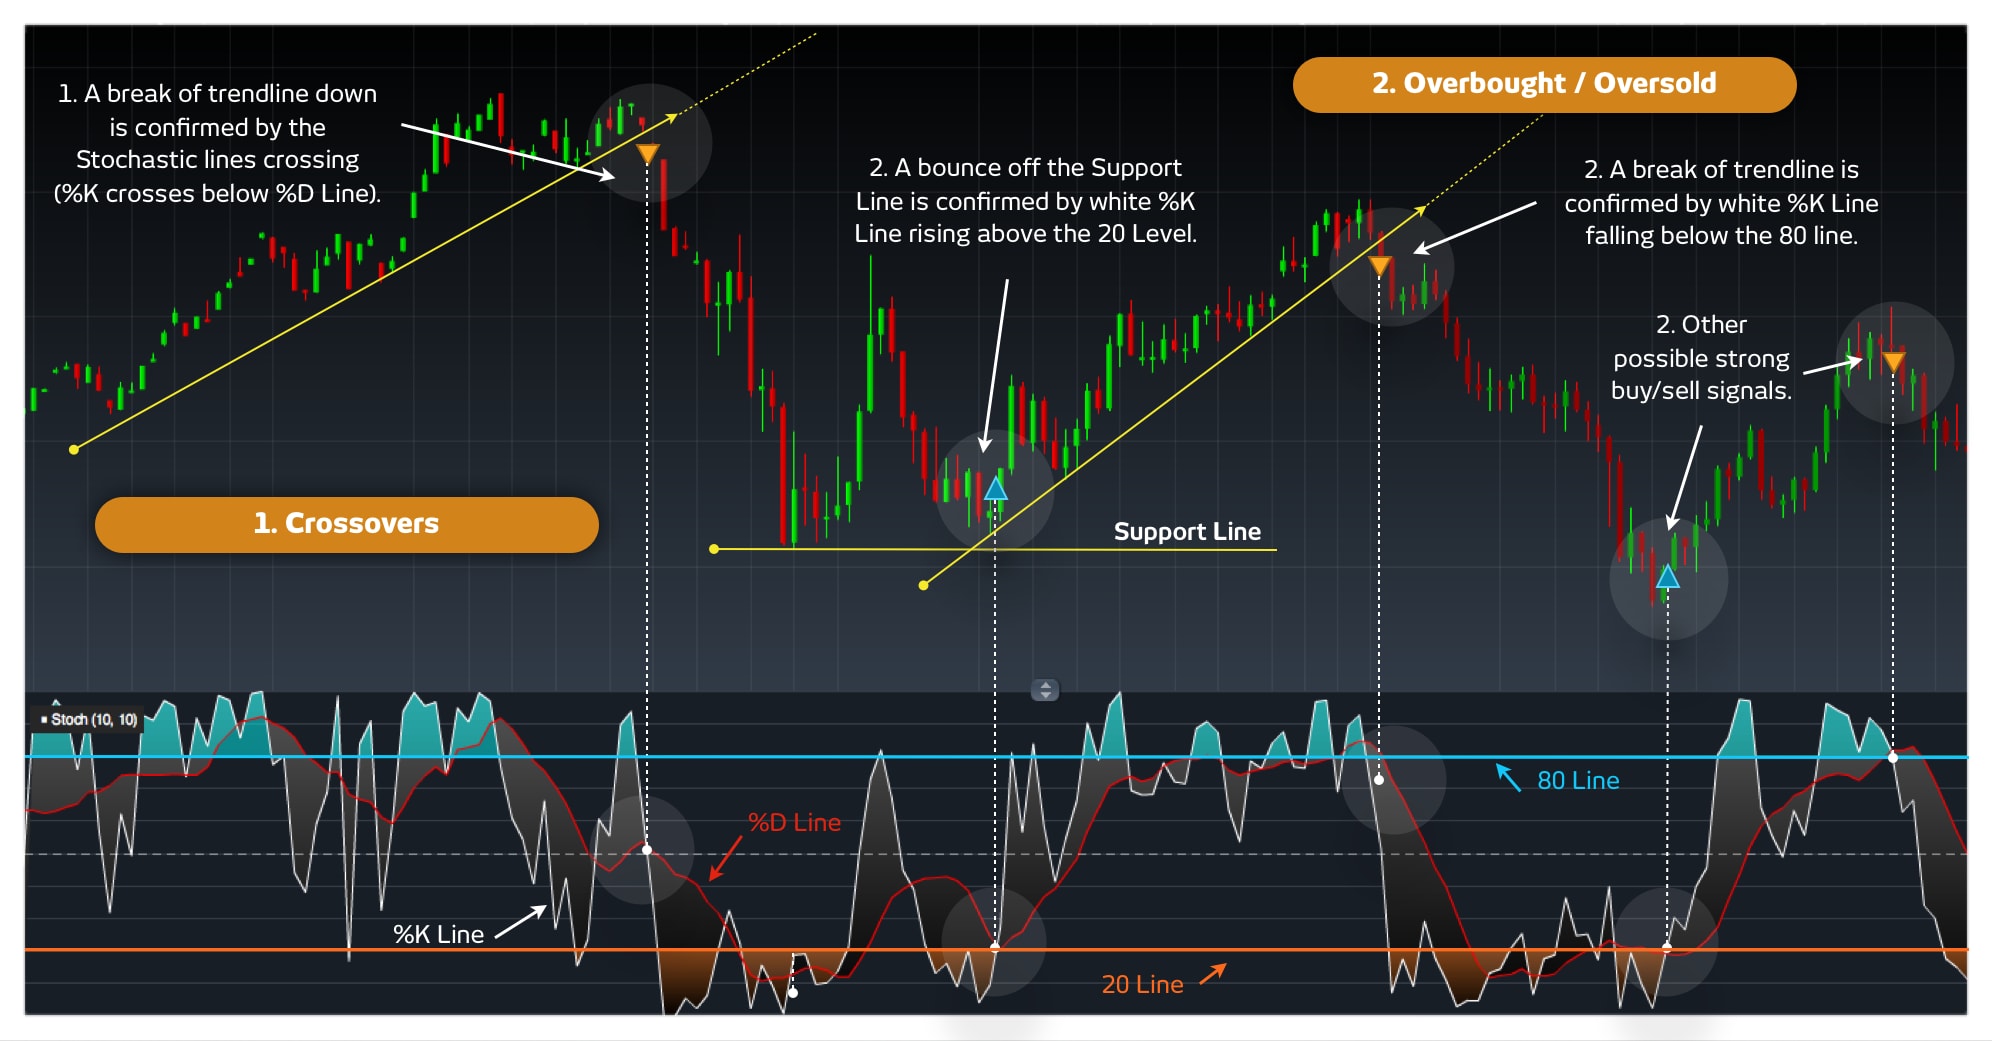
- Momentum Indicators: These measure the speed and change of price movements. They're like your speedometer, telling you how fast the market is moving. Examples include the Relative Strength Index (RSI) and the Stochastic Oscillator.
- Volatility Indicators: These measure the market's volatility, or how much the price fluctuates. They're your turbulence detectors, warning you of potential rough patches. Examples include Bollinger Bands and the Average True Range (ATR).
How to Use Indicators Effectively
Now that you know the types of indicators, let's talk about how to use them effectively. Remember, the key is to combine different indicators to get a comprehensive view of the market.
Combining Indicators for a Comprehensive View
Using just one indicator is like trying to drive a car with only one eye open. You need a full view to make the right decisions. For example, you might use a Moving Average to identify the trend, an RSI to gauge momentum, and Bollinger Bands to measure volatility. This combination gives you a well-rounded view of the market.
Setting Up Your Chart
First, choose a reliable charting platform. Many brokers offer built-in charting tools, but you can also use standalone platforms like TradingView or MetaTrader. Once you're set up, add your chosen indicators to the chart. Most platforms allow you to customize the settings to fit your trading strategy.
Interpreting the Signals
Interpreting signals from indicators is like reading a foreign language. It takes practice, but with time, you'll become fluent. For instance, if the RSI is above 70, it might indicate that the stock is overbought. If the price crosses above the Moving Average, it could signal a bullish trend. Always remember, no single indicator is foolproof. Use them in combination for better accuracy.
Common Pitfalls to Avoid
While indicators are powerful tools, they're not perfect. Here are some common pitfalls to avoid.
Over-Reliance on Indicators
Indicators are just one piece of the puzzle. Don't let them cloud your judgment. Always consider other factors like fundamental analysis, news events, and economic indicators. Remember, the market is influenced by a multitude of factors, not just technical signals.
Ignoring Market Context
Indicators work best when used in the right context. For example, a bullish signal in a bear market might not be as reliable as in a bull market. Always consider the broader market trends and economic conditions.
Practical Examples
Let's look at a few practical examples to illustrate how to use indicators in stock market trading.
Example 1: Moving Averages and RSI
Suppose you're looking at a stock with a 50-day Moving Average and an RSI. If the price crosses above the 50-day MA and the RSI is below 30, it could signal a buying opportunity. Why? Because the price crossing above the MA indicates a potential uptrend, and the low RSI suggests the stock is oversold.
Example 2: Bollinger Bands and ATR
Consider a stock with Bollinger Bands and an ATR. If the price touches the upper Bollinger Band and the ATR is high, it might indicate a potential reversal. The high ATR suggests increased volatility, and the price touching the upper band could mean the stock is overbought.
Conclusion
Using indicators in stock market trading is like navigating a ship. You need a compass (trend indicators), a speedometer (momentum indicators), and a turbulence detector (volatility indicators) to steer clear of storms and stay on course. Remember, no single indicator is foolproof. Combine them, use them in context, and always keep learning. The stock market is a dynamic beast, and the more tools you have in your toolkit, the better equipped you'll be to tame it.
So, are you ready to dive into the world of technical indicators and take your stock market analysis to the next level? Start small, practice regularly, and always stay informed. The market waits for no one, but with the right tools and knowledge, you can stay one step ahead.
FAQs
1. What are the best indicators for a beginner?
For beginners, it's best to start with simple and widely-used indicators like Moving Averages, RSI, and Bollinger Bands. These are relatively easy to understand and can provide a solid foundation for your trading strategy.
2. Can I rely solely on technical indicators for trading?
While technical indicators are powerful tools, they should not be your sole basis for trading decisions. Always consider fundamental analysis and market context for a more comprehensive view.
3. How do I know which indicators to use?
The choice of indicators depends on your trading strategy and the specific market conditions. Experiment with different combinations and see what works best for you. Remember, there's no one-size-fits-all answer.
4. What is the best time frame for using indicators?
The best time frame depends on your trading style. Day traders might use shorter time frames like 1-minute or 5-minute charts, while swing traders might use daily or weekly charts. Choose a time frame that aligns with your goals and risk tolerance.
5. How do I avoid false signals from indicators?
False signals are a common challenge in technical analysis. To minimize them, use multiple indicators in combination, consider the broader market context, and always confirm signals with other forms of analysis. Additionally, practice and experience will help you become better at distinguishing between genuine signals and noise.
```
Posting Komentar